
If you’ve ever wondered why chasing one trait in your breeding program seems to nudge another along for the ride, sometimes in the opposite direction, you’re not imagining it. That’s genetic correlation in action.
The inspiration for this piece came from a post Ferg shared recently on The Hub. He looked at the correlations between wrinkle, fat and other traits in the Merino Select database. It got me thinking about how often we see these relationships playing out across livestock species. Whether it’s sheep or cattle, the same story applies. Change one trait, and something else shifts.
You may think of breeding values as tidy, separate boxes; growth here, fertility there, carcase traits somewhere else. But with genetics, it’s more like a spider’s web. Pull one thread, and everything connected to it moves too. Sometimes that’s helpful. Sometimes it’s a headache. Most of the time, it’s both.
Understanding genetic correlations is one of the most powerful and underused ways to build direction and balance into a livestock breeding program. It’s how we move from chasing traits to strategic selection.
What the Merino data shows: a heatmap of genetic correlations
To see what’s happening in the wider Merino population, we downloaded breeding values for sires in the MERINOSELECT database with genomic data available and at least 30 progeny recorded.
We then ran the data through neXtSelect, our go-to tool at neXtgen Agri for exploring trait relationships. It’s brilliant for visualising a flock or herd’s strengths and weaknesses, and we often use it when designing custom breeding indexes for clients.
The output is a correlation heatmap: red means a positive correlation (as one trait increases, the other tends to increase as well), and blue means a negative correlation (as one goes up, the other goes down) (figure 1).
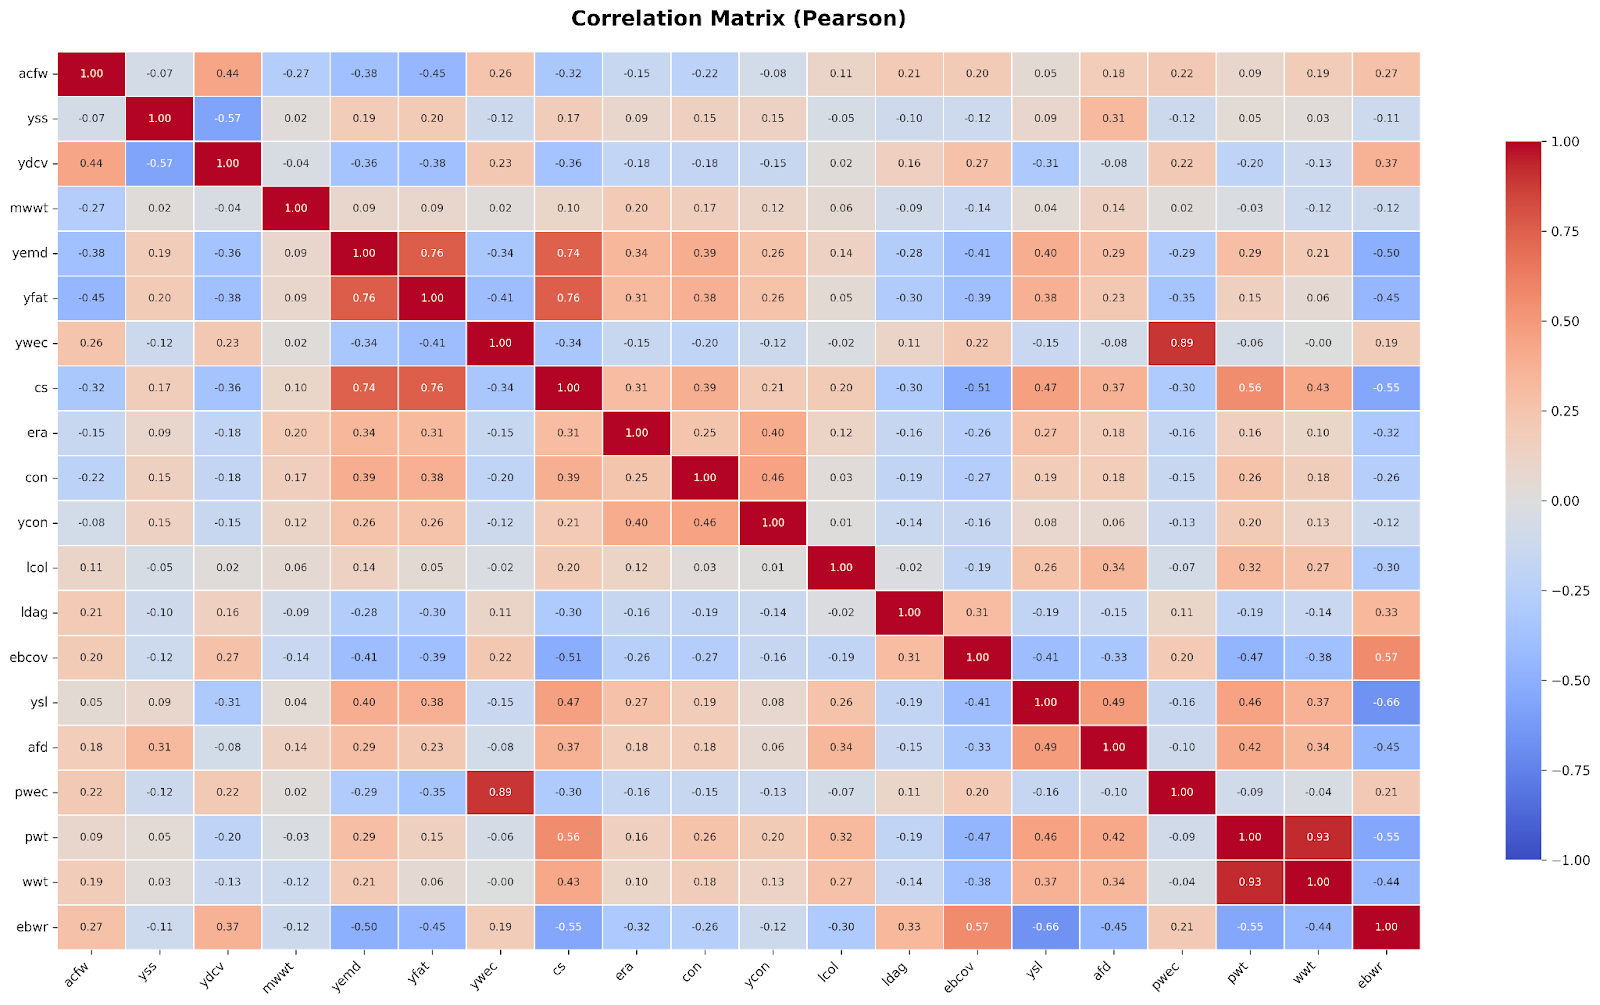
Figure 1: Genetic correlations among Merino sires in the MERINOSELECT database with genomic data available and more than 30 progeny (accessed October 9, 2025).
How to read a genetic correlation
A genetic correlation ranges from +1 to -1:
- +1 means traits move perfectly together. Improve one, and the other always improves.
- -1 means traits move in opposite directions. Improving one will reduce the other.
- 0 means there’s no genetic link. You can change one without affecting the other.
Most livestock traits sit somewhere between -0.5 and +0.7, the range where the interesting trade-offs happen, the ones that shape how fast and how sustainably we make genetic progress.
Wrinkle × fat: a classic Merino example
Let’s start with wrinkle (EBWR) versus fat depth (YFat). In the Merino data, these traits have a strong negative correlation of around –0.45. That means selecting for higher fat (more subcutaneous cover) will generally result in plainer-bodied, less wrinkly sheep. Flip it around, and selecting for heavier skin types or more wrinkle will genetically reduce fat cover.
If your goal is to lift YFat for fertility, lamb survival, and do-ability, that negative correlation actually works in your favour. Over time, you’ll find yourself breeding plainer, easier-care sheep as a natural flow-on effect.
This example also shows why correlations aren’t good or bad; they just are. It’s how you use them that matters.
Understanding favourable and unfavourable correlations
A common mistake is assuming that positive correlations are good (ie the red squares in the heatmap) and negative ones (the blue squares) are bad (figure 1).
In reality, ‘positive’ and ‘negative’ simply describe direction, not desirability.
- Fleece weight and fibre diameter are positively correlated. Select for fleece weight, and you’ll likely increase micron. That’s fine if you’re targeting a medium wool market, but not so great if you’re chasing fine-wool premiums.
- In cattle, selecting for faster growth often increases mature cow size and feed requirements, a positive correlation that may not be favourable, depending on your environment.
Understanding which correlations are working for you and which are working against you is what separates reactive breeders from intentional ones.
Other patterns in the Merino data
Looking across the Merino sires dataset (figure 1), a few consistent patterns stand out:
- Muscle (YEMD) and fat (YFat) are strongly positive (~0.75). Sheep that are more muscular also tend to have better fat cover.
- Condition score (CS) shows strong positive correlations with both muscle and fat, confirming that robust, well-conditioned animals generally express both.
- Clean fleece weight (ACFW) is negatively correlated with both muscle and fat, emphasising that high fleece production often comes at the cost of body condition.
These aren’t just theoretical patterns. They reflect the underlying biology of resource allocation: animals can only partition so much energy into growth, reproduction, wool or body reserves. Pushing one too far often comes at the expense of another.
The science behind genetic correlations
Genetic correlations are calculated using large datasets of animals with known pedigrees and performance records, often strengthened by genomic information. The models used separate what’s due to genetics versus environment, allowing scientists to estimate how genes influencing one trait also affect another.
These relationships exist for two main reasons:
- Pleiotropy: one gene affects multiple traits.
- Linkage: separate genes influencing different traits are located close together on a chromosome, and tend to be inherited as a group.
Recent work by Chebib and Guillaume (2021) explored the balance between these effects and found that pleiotropy often drives much of the observed correlation between quantitative traits.
For instance, genes that influence muscle growth also impact metabolism and fat storage. The physiological systems that manage energy balance, reproduction, and growth are tightly connected, so it’s no surprise their genetic control overlaps.
Environmental selection reinforces this, too. Animals that can maintain fat and muscle through a tough season are more likely to rebreed and rear a lamb or calf, so those favourable combinations get passed on, strengthening the genetic link.
Genetic correlations in cattle
The same principles also apply in cattle breeding:
- Growth and birthweight: Strong positive correlation. Selecting purely for faster growth will almost always lift birthweight, and with it, calving difficulty risk. It’s one of the most important correlations to manage carefully in seedstock herds.
- Muscle and fat depth: Positive correlation. Animals that carry more muscle tend to hold a bit more fat, up to a point.
- Fertility and growth: Slightly positive, but it varies by breed and environment. Pushing extreme growth can lengthen maturity patterns and delay heifer puberty in some lines.
None of these correlations is ‘good’ or ‘bad’. They’re simply trade-offs. The key is knowing which direction serves your breeding goals and production system.
Why correlations matter in a breeding program
Ignoring correlations is one of the quickest ways to run into genetic dead ends. You might be making gains on one front while quietly losing ground on another.
Producers see this all the time:
- Rams with exceptional wool cut but poor doing ability.
- Bulls with high growth but increasing calving issues.
- Sheep that grow fast but fade in fertility under pressure.
Understanding genetic correlations turns those frustrations into foresight. It explains why those patterns appear and gives you the tools to manage them.
Indexes are built on this principle. Every index used in Sheep Genetics or BREEDPLAN includes correlations between traits. That’s how they balance performance, fertility, and profitability rather than chasing single-trait extremes.
Putting correlations to work with neXtselect
This same principle underpins our custom index tool, neXtSelect. The tool accounts for the genetic relationships between traits and converts them into an index that reflects your environment, markets and breeding goals.
neXtSelect weights each trait according to its importance while balancing its interactions with others. Each year, index values are calculated for progeny and presented in clear, ranked lists to guide selection. This provides a single figure that captures every relevant trait in the right proportion to help simplify breeding decisions.
As markets and breeding goals evolve, neXtSelect can be updated to align with new targets or changing conditions, helping to manage trade-offs and minimise the impact of unfavourable genetic correlations.
Avoiding the trap of single-trait selection
Every livestock industry has stories of what happens when correlations are ignored.
In the 1980s and 1990s, heavy emphasis on fleece weight in Merinos led to finer, higher-cut fleeces but also higher wrinkle and flystrike risk. In beef, selecting purely for growth produced bigger cows and higher feed requirements, which hurt fertility and system efficiency.
Today, we’ve learnt from these stories. Index selection, genomic tools, and correlation data let us design breeding programs that make progress without creating new problems. The challenge is using those tools deliberately, not reactively.
Translating the numbers into on-farm reality
Genetic correlations aren’t just interesting; they’re the link between what happens on paper and what you see in the paddock.
They explain why:
- Your best-doing ewes are usually your plainer ones.
- Fast-growing bulls might lift birthweight risk.
- Balanced animals outperform ‘specialists’ in real-world systems.
Once you stop fighting correlations and start using them, breeding gets easier. They’re signals about how traits move together and how you can use one to pull another.
For example:
- Selecting for muscle and fat will quietly reduce wrinkle in your Merinos.
- Chasing growth? Keep cow size in check with indexes that balance mature weight.
- Building resilience? The more data you record on condition and fertility, the clearer the link between rebreeding and body reserves becomes.
Over time, with consistent and accurate recording, the clearer these relationships become, and the more confidently you can select with purpose.
Practical tips for producers
- Use indexes that match your production goals. They already account for correlations and economic weightings. For a fully customised approach, our neXtSelect tool can build an index specific to your breeding objectives.
- Record what matters. Focusing on traits linked to your breeding goals gives clearer, more useful correlations.
- Watch for unintended shifts. If one trait is changing faster than expected, look for correlated traits that might explain why.
- Balance beats extremes. Sustainable progress comes from keeping things in balance, not pushing traits too far.
- Don’t fear negatives. Sometimes a negative correlation is your friend, as in the case of wrinkle and fat. Learn which direction helps your system.
Balance over extremes
Genetic correlations remind us that traits don’t exist in isolation; improving one almost always influences another. A positive correlation isn’t automatically good, and a negative one isn’t necessarily bad. What matters is whether the direction aligns with your breeding goals. That’s where indexes earn their keep, managing complexity by balancing multiple traits toward profitability and system fit.
The more broadly you record, the clearer the relationships become, helping you spot both opportunities and unintended shifts early. In the end, progress that lasts comes from balance and consistency, not extremes. Once you understand the genetic links tying your flock or herd together, you can make confident, purposeful decisions and improve with intent rather than by chance.
-----
Join the conversation on The Hub
Take a moment to head over to the neXtgen Agri Hub to share your comments and questions. We’d love to hear your thoughts on genetic correlations.
References and further reading
Merino correlations (Hub post) - Dr Mark Ferguson
neXtSelect custom index design from neXtgen Agri
Chebib, J. & Guillaume, F. (2021). Pleiotropy or linkage? Their relative contributions to the genetic correlation of quantitative traits and detection by multi-trait GWA studies. Genetics, 219(4), Article iyab159. https://doi.org/10.1093/genetics/iyab159


.jpg)


